What's new in version 8.1
Besides bugs fixes and performance increases from the previous version, Chart FX for WPF 8.1 also introduces a series of new features. From a handful of different galleries and more customization on existing properties to a new real-time feature and Statistical extension, as detailed below:
-
Statistical Extension
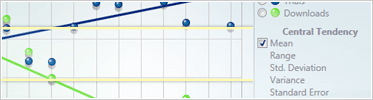
Statistical analysis capabilities to your charting applications. This extension comes with a full API that handle mathematical operations and algorithms to realize information including Standard Deviation, Variance, Regression Line, Normal Distribution and F-Test to name a few.
-
Real Time
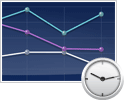
Binding data to observable collections has always been possible with Chart FX for WPF. Using the Real Time API instead will make the chart reutilize internal components allowing it to handle a large quantity of fast data without compromising on performance. The Real Time API is great for applications handling financial data or other real world information that needs to be displayed accurately.
-
Density Gallery
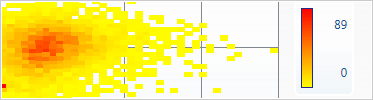
Complementing the wide variety of galleries present on earlier versions of Chart FX for WPF, the Density Gallery allows visualization of quantity of points in a specific area. Great for use in Quality Control or tracking clicks on a website.
-
Heatmap Chart
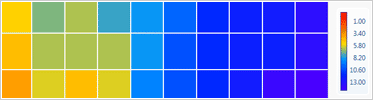
A two dimensional table that displays data on a gradient scale.
-
Pareto Chart
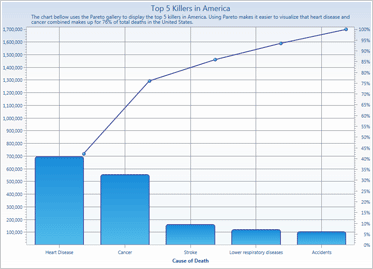
Vilfredo Pareto, a turn-of-the-century Italian economist, studied the distributions of wealth in different countries, concluding that a fairly consistent minority - about 20% - of people controlled the large majority - about 80% - of a society's wealth. This same distribution has been observed in other areas and has been termed the Pareto effect. Chart FX for WPF 8.1 allows you to set up a Pareto Chart with ease, much like any other gallery.
-
Overlay Bubbles
A new gallery that compares the data using concentric circles.
-
Waterfall Chart
Also called Flying Bricks Chart or Mario Chart, this gallery helps analyze cumulative effect.
-
Variable Series Palette
A new palette that allows the user to determine colors depending on the number of series on the chart. Very useful on scenarios where a Red/Green chart makes sense for two series, but a red to orange gradient is more visually appealing for more data.
-
Axis synchronization
A multiple Y axis chart is now much more visually pleasing and easy to read now that the axis steps can be synchronized. If this synchronization is not desired because each axis needs specific steps, don't worry. Both ways are supported.
-
Progression Transform
Bubble charts are a valuable tool to perform a three variable comparison, allowing for easy visualization of complex interdependencies that are not apparent in two variable charts. Overlaying bubble charts gives you yet another variable (or dimension) for comparison. Bubble charts displaying GDP, population growth and inflation rate for different countries can now be compared over different years on the same chart, for example.
Version 8.1 is available now as part of the Studio FX Premium Subscription.
Other Features
Promotions
New Version 8.1 Released
Test Drive Chart FX for WPF and WIN!

 Think you have what it takes to win? Well, this is your chance to prove it! Submit your charts built using Chart FX for WPF and Visual Studio 2010 and you will be automatically entered for a chance to win a FREE Amazon Kindle. Winners will be announced via email. To participate, simply Send us your best looking Chart FX for WPF charts.
Check Out Chart FX for WPF in Action!
Silverlight Products

The Chart FX Silverlight Add-On extends Chart FX 7 and allows developers to add Chart FX functionality to their Silverlight web applications.
WPF Community Blog
Chart FX for WPF Resources

Visit our blog to read the latest posts on Chart FX for WPF and its groundbreaking technology.

Interact with the Chart FX for WPF Demo Application used in Tim Huckaby's presentation at TechEd 2008.
Note: .NET 3.0 is required to run this sample.
Download the latest .NET Framework which supports WPF development.