 |
|
 |
|
|
 |
|
 |
|
| Overview
|
 Financial Financial |
|
OLAP |
| Statistical |
|
Maps |
| Licensing
|
| Pricing |
|
Support |
| Download Trial
|
|
Purchase |
|
Chart Gallery |
|
|
 |
|
 |

|
|
|
|
 |
|
|
|
|
 |
 Value Range Coloring Value Range Coloring
Coloring of map areas based on its value range. This is very useful for depicting
scenarios like “Sales per Region”, etc.
Winning Series
Support of “winning” series for data sources with multiple columns.
This is very useful for scenarios like “Election Winner” or “Top
Selling Product”.
Multilevel Maps
Automatic support of drilldown and auto-summarization. This allows for the creation
of Regions and Sub-regions. Simply provide the data for the bottom level and Chart
FX Maps summarizes the data for the upper levels.
Conversion Tables
Raw data does not need to match the map object names exactly with the use of conversion
tables.
Scalability
All maps are perfectly scalable, through the use of Scalable Vector Graphics (SVG)
technology.
Comprehensive UI
Comprehensive user interface with support for drilldown, level selection, highlighting,
and zooming.
|
|
|
|


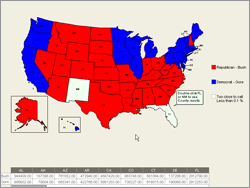
 Chart FX Maps was designed
with extensibility in mind. You can design your own custom SVGs and import them
into your Chart FX Maps project.
Chart FX Maps was designed
with extensibility in mind. You can design your own custom SVGs and import them
into your Chart FX Maps project. Do you need custom maps? We can create custom maps to suit your
specific requirements. Please contact our support team for more information on our
Custom Maps Service.
Do you need custom maps? We can create custom maps to suit your
specific requirements. Please contact our support team for more information on our
Custom Maps Service.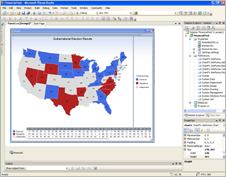 Chart FX Maps provides a full library
of dynamic maps that you can integrate with Chart FX to display data graphically
through objects in a map. Chart FX Maps, a .NET control, not only offers a comprehensive
svg maps library, but it also allows the developer to add their own custom maps
through the universal SVG standard.
Chart FX Maps provides a full library
of dynamic maps that you can integrate with Chart FX to display data graphically
through objects in a map. Chart FX Maps, a .NET control, not only offers a comprehensive
svg maps library, but it also allows the developer to add their own custom maps
through the universal SVG standard.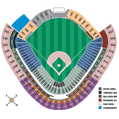 Savvy
developers understand that flexibility is a major asset to any component. Understanding
this, Chart FX Maps allows you the freedom to map non-geographical data in the same
manner you would use a map. Whether it's a seating chart, an architectural diagram
or a technical illustration, Chart FX Maps will allow you to visualize data using
your own custom SVGs. Whatever you can envision, Chart FX Maps can realize.
Savvy
developers understand that flexibility is a major asset to any component. Understanding
this, Chart FX Maps allows you the freedom to map non-geographical data in the same
manner you would use a map. Whether it's a seating chart, an architectural diagram
or a technical illustration, Chart FX Maps will allow you to visualize data using
your own custom SVGs. Whatever you can envision, Chart FX Maps can realize.