Software Development
July 2004
Charting
New Meaning
Creating professional charts that respond well to wide ranges of data is no easy
task. Fortunately, some great .NET charting engines are now available for many
applications.
By Dennis Adams
In his landmark book The Visual Display of Quantitative Information (Graphics
Press reprint edition, 1992), Edward Tufte devotes an entire chapter to “chartjunk.” Quoth
the graph-master: “The interior decoration of graphics generates a lot
of ink that does not tell the viewer anything new.” Substitute “pixels” for “ink,” and
this statement applies to computer-generated charts and graphics that can be
drawn faster than they can be discarded.
Whether your design specification included charting from the beginning or
users screamed for it at the eleventh hour, it’s worth looking at third-party
charting engines simply to benefit from the years of refinement that produced
layout and drawing engines. Making a simple chart is a snap, but professional
charts that respond well to wide ranges of data are no easy task. Fortunately,
some great .NET charting engines are now available for a raft of applications.
The Criteria
Architectural Trade-offs be shifted between the server and the client. For
example, the charting engine on the server can do all of the work, turning
data into charts rendered as bitmap images, which can be drawn by any graphical
browser. Alternatively, an on-demand downloaded browser plug-in can accept
data from the server and render it directly on the client. This allows for
client-side data zooming and changes to the chart type or color, as well as
other manipulations. While these advantages might be worthwhile for intranet
or vertical market projects, the disadvantages include browser and platform
compatibility issues, and more recently, security concerns about downloaded
components. Finally, a hybrid approach is for the server to render the chart
in vector form, such as SVG (Scalable Vector Graphics) or Macromedia Flash
format, to be rendered on the client. This reduces network bandwidth and offloads
some of the work from the server to the clients. For text-only browsers, or
to make your charts accessible to people with disabilities (as required by
Section 508 of the Rehabilitation Act Amendments), you’ll want the ability
to create “alternate text” HTML tags that describe your chart and
the values it represents.
Chart Options: Although most products include basic chart types, such as line,
bar, pie and XY scatter charts, as well as multiple series to be graphed in
the same chart in the same or mixed styles (line over bar, for example), your
application may have needs above and beyond the basics, such as customized
drawing on the chart or support for very large data sets. An application that
calls for a specific kind of chart, such as maps, area charts or 3D surfaces,
might narrow your field of choices to a single product.
Populating the Engine: There are nearly as many ways of getting data into
a charting engine as there are ways of drawing them. Charting starts with a
series—a set of data points with values—that may be populated by
setting their properties directly. Often, series can also be populated from
a database, either directly or via .NET conventions. Sometimes, a series can
be populated from text or XML files. If you already have a specific database
in use, make sure the charting engine you’re interested in can talk to
it, or you’ll need to write an access function that pumps the data from
the database to the charting engine. If you need the chart to update in real
time as new data becomes available, make sure your charting engine can handle
this possibility.
Avoiding Chartjunk: No amount of database connectivity will make up for a
poorly rendered, hard to read or otherwise inferior chart. While a certain
amount of chartjunk—such as shadows, 3D perspective, bitmap or gradient
fills, can be expected—it can quickly get out of hand, especially when
rendered with a garish color palette. A good charting product has a gallery
of presets, with professionally designed color palettes to choose from, so
even the non-artists among us can make nice-looking charts. For elegant finishing
touches, a good layout engine can avoid label collisions using repositioning
or callouts, and will use modern rendering techniques such as anti-aliasing
(to eliminate jagged edges and stair-stepped lines) and soft shadows (to make
your chart subtly “pop out” from the background). Various chart
framing options may be available to help the chart combine with other elements
on the page.
Interactivity:In some cases, you may want to make your charts interactive.
For example, moving the mouse over a chart element could pop up a tooltip-like
window to show the data value, or clicking on an element could “drill
down” into a chart or table (or entire Web page) showing the source for
that data. If interactive charts are needed, make sure to evaluate packages
for their depth and elegance in tagging chart elements at the level you require.
Licensing: Finally, there’s a wide range of licensing options. A vendor
may charge per developer, with unlimited royalty-free uses, while another may
charge per-server or even server CPU. Depending on the type and size of your
deployment, licensing costs could vary widely, so it’s a good idea to
look into licensing before making your final decision.
Chart FX for .NET
Software FX has been in the charting business for a number of years, and this
shows in many places, such as the visual quality of the charts and the number
of chart types available.
As soon as you create a Chart FX object in Visual Studio, the design wizard
pops up, allowing you to select the chart type, color palette, legends and
labels. The wizard can also be re-launched later to make changes without starting
over. Also, samples that have C# and VB .NET source code are provided. An extension
that can do geographical and political boundary map charts, or can be set up
for other graphical maps, such as airplane seating charts, is also available.
Help is integrated into Visual Studio.
Data binding is via direct object API, text file, XML file, databases using
ADO.NET, data providers, collections and arrays, or crosstabs. A SOAP/XML-based
extension allows clients to connect to data servers for streaming real-time
charts.
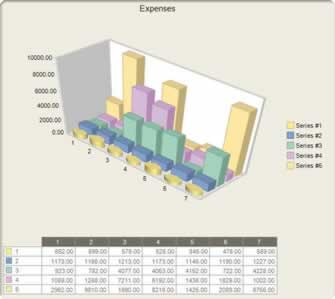
Good-Lookin’ Graphs
Chart FX generates very nice-looking charts, with good anti-aliasing and layout.
|
Chart FX generates very nice-looking charts, with good anti-aliasing and layout
(see “Good-Lookin’ Graphs”).
Annotation objects can be added to any chart, and a wide variety of framing
options are available to integrate the chart into your Web page.
Standard PNG and JPEG raster formats, as well as SVG for client-side rendering,
are supported. Image maps provide interactivity when using the PNG raster format,
with custom URLs per series or per point. For Windows .NET clients, a managed
code plug-in component is available that provides full interactivity with the
chart, including chart type, 3D rotation, zooming and scrolling, and even “what-if” changing
of the data in the data view. The toolbar for this component is configurable,
and you can add and remove buttons as needed for your application. These formats
can be streamed directly to the client without creating temporary files. With
an additional extension download, the Macromedia Flash format can be used,
and it also offers drill-down interaction. Software FX has an informative white
paper comparing server-side and client-side components on its website. Finally,
Software FX embraces accessibility through another downloaded extension that
provides the necessary functionality to make Chart FX accessible to people
with disabilities, as required by Section 508.
Charting Your Course
While any of these products will satisfy modest charting needs, your application
may demand discriminating features like real-time charting, large data sets,
specialized chart types or drawing directly on the chart. To make a wise
selection, explore the free evaluation versions available on your own data,
see which documentation package or technical support program fits your needs
and evaluate licensing. But please, don’t let dreaded chartjunk invade
your application, or you might just end up in Mr. Tufte’s next book—for
all the wrong reasons.
|
Chart FX 6.2 |
Software FX
5901 Broken Sound Parkway, Suite 400
Boca Raton, FL 33487
Tel: (800)999-8888
www.softwarefx.com |
Pricing Scheme:
Free evaluation is available. A single-copy license, which includes
one developer license and one server license (unlimited CPUs),
is $2,699, or $2,999 with one year of priority suppport. Additional
developer licenses are $899, and additional server licenses are
$1,599.
|
|
|
Rating: 4 stars |
The
Rate Sheet |
Pros:
- Chart FX is a highly evolved and capable charting engine with great-looking
output.
- The re-entrant wizard for setting chart type, color palette, legends
and labels (but no data binding) is very useful.
- A number of downloaded extensions add nice additional functionality.
|
Cons:
- The product is a big investment for
companies with modest charting needs.
- Some chart types are limited in the number of series elements.
- The wizard doesn’t help with data binding.
|
This is an excerpt from the CMP - Software Development Magazine website.
To read the entire article, please visit Software
Development website.
When he’s
not informally testing the performance envelopes of modern street tires or
building dangerous projects with his children, Dennis Adams develops
state-of-the-art media editing software.
|

